Find the missing data - interpolation and extrapolation with Python
When you have a set of data, there is a high chance that it is incomplete. Not only does the data, outside the given range not exist, but also values between known ones are missing. But what if your work relies on that missing data?
You can use interpolation and extrapolation to fill the missing gaps in your data set and extend it beyond the known data.
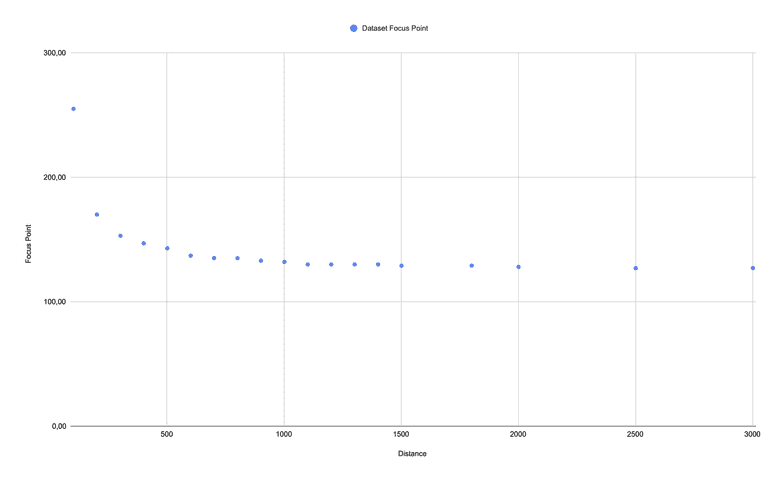
The dataset in our example describes the focus position which has to be set to a digital camera so that the object at the given distance is sharp.
The dataset is composed of two values:
x = distance in mm as keyy = focus position as value

dataset = {
  100: 	    255,
  200: 	    170,
  300: 	    153,
  400: 	    147,
  500: 	    143,
  600: 	    137,
  700: 	    135,
  800: 	    135,
  900: 	    133,
  1000:     132,
  1100:     130,
  1200:     130,
  1300:     130,
  1400:     130,
  1500:     129,
  1800:     129,
  2000:     128,
  2500:     127,
  3000:     127,
  3500:     127,
  5000:     127,
  10000:    127
}
To create the initial dataset, we have placed an object in front of the camera in different distances and set the focus value manually until the object was displayed sharp.
Interpolation versus extrapolation
Both are mathematical techniques to find data between or outside an existing data range. An interpolation fills the gaps between know values while an extrapolation extends beyond known data.
The reliability of both depends on the following factors:
- Data quality
- Data density
- Data range
- Context
There are several methods of interpolation and extrapolation, but I will focus on the linear and cubic splines.
The Linear method
The linear method assumes a linear relationship between known data points and uses this assumption to estimate missing values.
The basic idea behind it is to draw a straight line between two data points and use that line to calculate the value at some point between those two data points or next to them.
import numpy as np

dataset = {
  100: 	    255,
  200: 	    170,
  300: 	    153,
  400: 	    147,
  500: 	    143,
  600: 	    137,
  700: 	    135,
  800: 	    135,
  900: 	    133,
  1000:     132,
  1100:     130,
  1200:     130,
  1300:     130,
  1400:     130,
  1500:     129,
  1800:     129,
  2000:     128,
  2500:     127,
  3000:     127,
  3500:     127,
  5000:     127,
  10000:    127
}

# generate x coordinates for which y should be populated
# from 100 to 3000 with an interval of 50
range = np.arange(100, 3000, 50)

# generate y
new_y = np.interp(range, list(dataset.keys()), list(dataset.values()))

new_dataset = dict(map(lambda i,j : (i,j) , range, new_y))

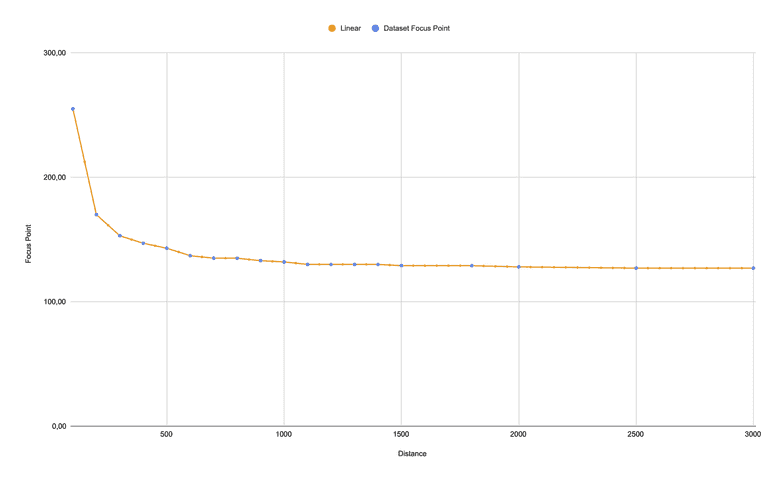
As you can see, our dataset is not linear. The nearer the distance, the more the focus point increases. At a larger distance, this does not seem to matter. But at a lower distance, the taken photo would not be sharp on generated data.
This method does not work for our dataset.
The Cubic Spline method
The spline method estimate values between data points by fitting a piecewise continuous and smooth curve, typically a polynomial, to the data. This method is particularly useful when you have a set of data points and want to create a continuous curve that smoothly passes through each point, providing a better approximation of the underlying relationship between the data.
There are various types of spline interpolation methods, with the most common one being cubic spline interpolation, which uses cubic polynomials to create a smooth and continuous curve.
from scipy.interpolate import CubicSpline
import numpy as np

dataset = {
  100: 	    255,
  200: 	    170,
  300: 	    153,
  400: 	    147,
  500: 	    143,
  600: 	    137,
  700: 	    135,
  800: 	    135,
  900: 	    133,
  1000:     132,
  1100:     130,
  1200:     130,
  1300:     130,
  1400:     130,
  1500:     129,
  1800:     129,
  2000:     128,
  2500:     127,
  3000:     127,
  3500:     127,
  5000:     127,
  10000:    127
}

# generate x coordinates for which y should be populated
# from 100 to 3000 with an interval of 50
range = np.arange(100, 3000, 50)

# Create a cubic spline interpolation function
cs = CubicSpline(list(dataset.keys()), list(dataset.values()))

# generate y
new_y = (cs(range))

new_dataset = dict(map(lambda i,j : (i,j) , range, new_y))

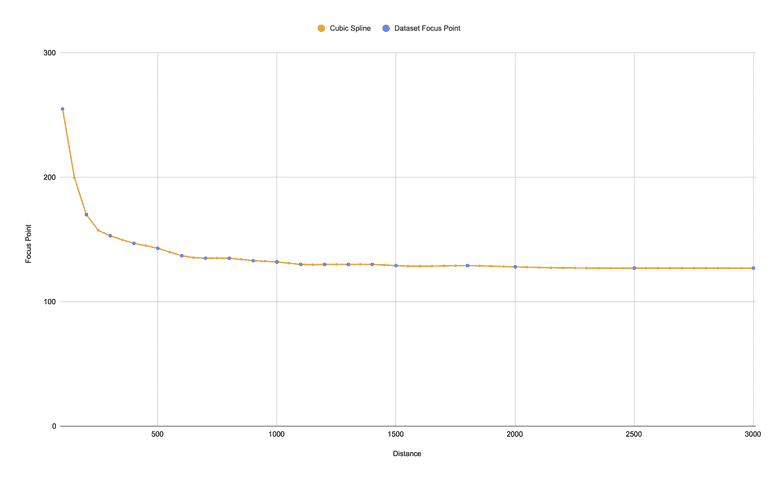
The curve passes smoothly through the existing data set - especially at lower distances. A perfect match.
Performance
Calculating missing data can be slow depending on the dataset and then method being used. If you need a fast response, think about creating a lookup table (LUT) with appropriate range and density.
You can then grab the nearest value for the
your_y = your_lut[min(your_lut, key=lambda x:abs(x-your_x))])
More methods
The SciPy module provides much more methods and functions for 1-D and multidimensional interpolation and extrapolation.